By Auste Eigirdas and Marcella Windmuller-Campione
Crosby Farm Regional Park is a 736-acre natural area in Saint Paul, MN along the Mississippi River. The dominant forest community type is floodplain forests; the vast majority (>95% of the basal area in some parts of the park) are composed of standing dead overstory green ash killed by emerald ash borer. Since the spring of 2019, standard measurements on planted seedlings have occurred during the growing season. During the spring of 2022, we tried a new method for capturing structure within the plots using Terrestrial laser scanning (TLS).
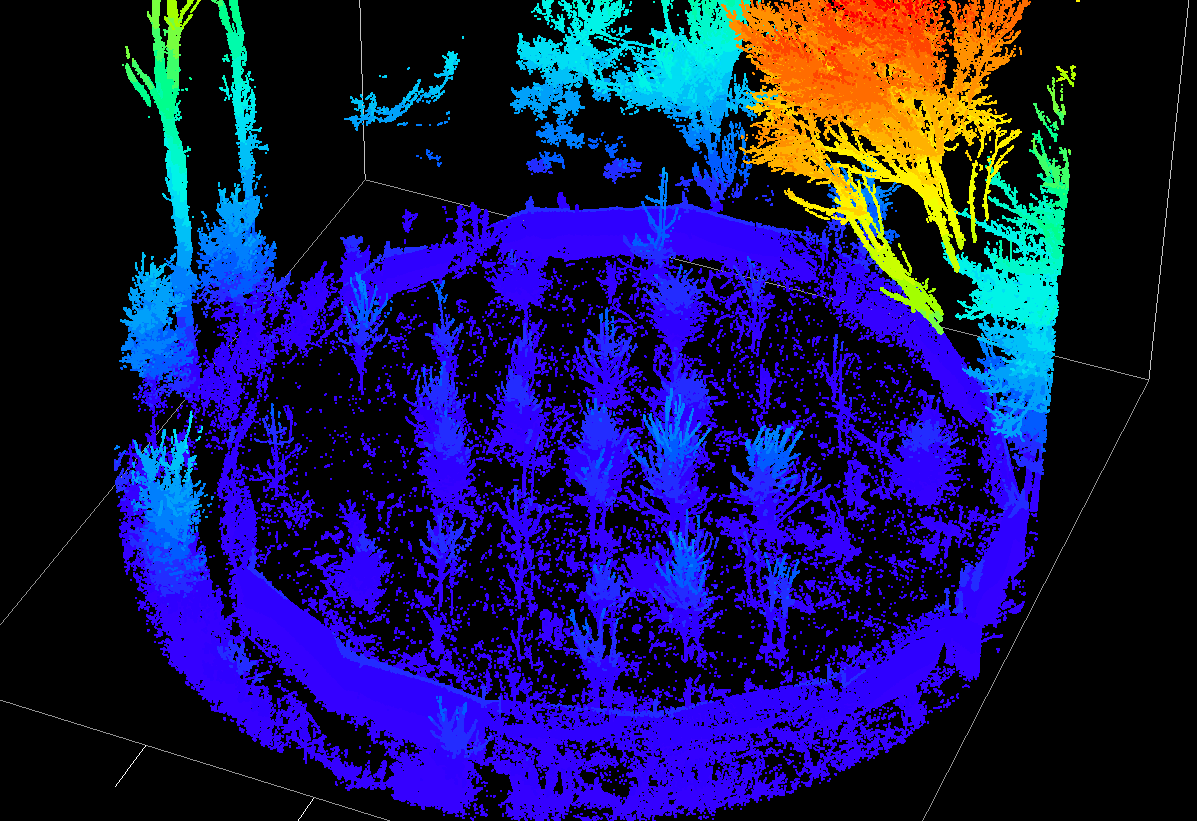
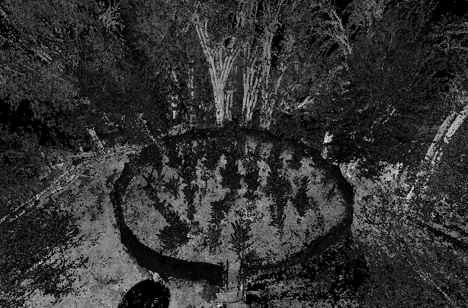
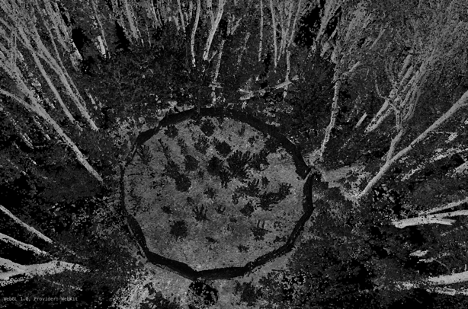
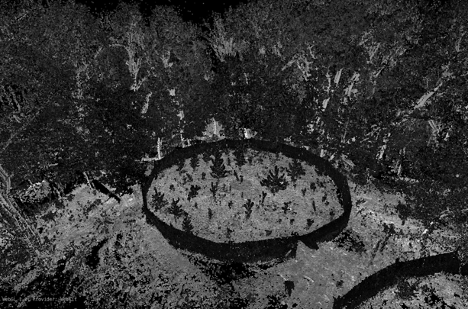
TLS, also known as terrestrial lidar, is a fairly novel approach that can acquire millimeter-level of detail from the surrounding area. A limited number of measurements are captured using traditional field measuring practices, whereas terrestrial laser scanners capture millions of measurements per scan. This high resolution data allows for more detailed monitoring of stand structure and seasonal dynamics in riparian forest ecosystems. Multiple scans were collected using the Trimble X7 scanner for each of the resistance, resilience, and transition treatment plots at plot center (n=24), and at 45, 135, and 225 degrees outside the plot fence line. Using sphere targets, scans were co-registered into a single 3D dataset of the plot with minimal occlusions caused by standing trees and fence line (Figure 1 and 2). Individual scan duration is approximately 2 minutes, and data collection occurred over two field days in April following snowmelt but prior leaf-out. Repeat scans will be collected during the growing season in 2022. Processing and analysis will occur in summer and fall of 2022.
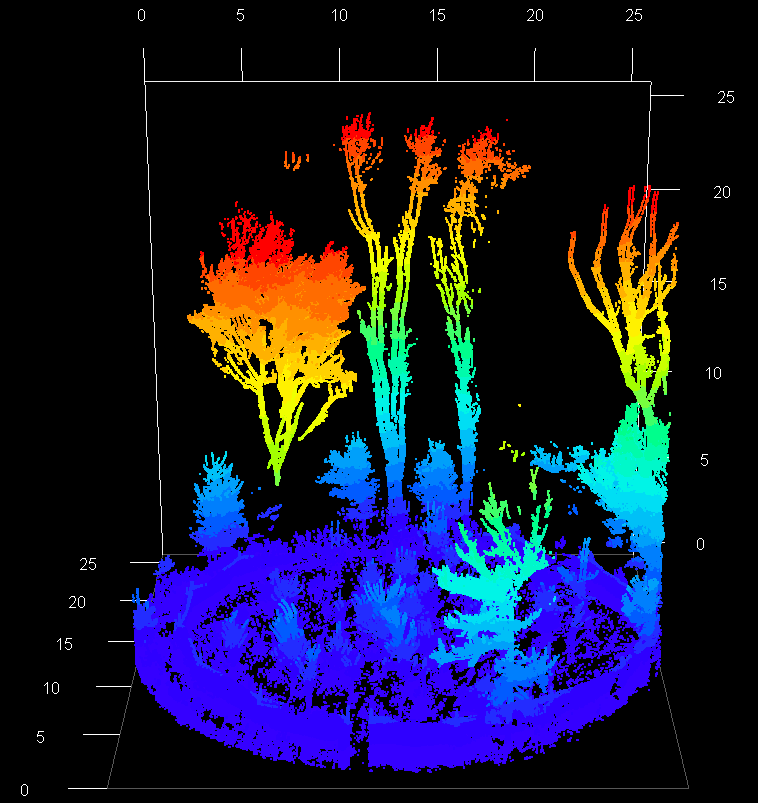
Forest inventory metrics can be derived to assess stand structure at higher certainty, such as the number and position of trees, diameter at breast height, as well as stem and crown shape parameters. Characterizing patterns in stand structure provides a greater understanding of the driving factors in floodplain forest processes and insight into best management practices in sustaining forested areas and promoting regeneration. In addition to airborne lidar, hemispheric photographs, and soil moisture and microclimate data collected at the field site, terrestrial lidar is another tool that can support researchers in understanding the predominant driving factors of regeneration and understory layer development in floodplain forests.